|
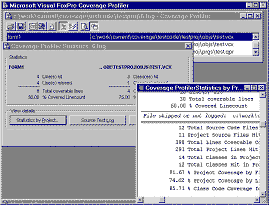
[ 1 ] [ 2 ] [ 3 ] [ 4 ] [ 5 ] [ 6 ] [ 7 ] [ 8 ] GR_STATS (shown here instanced as a subclass of the Coverage engine in COV_ENG2.PRG) is an " alternative" Coverage analysis interface, concentrating on a comparison of object-versus-linecount coverage on a file-by-file basis. The Coverage Profiler takes the information from the internally-produced coverage log and gives you information on the different types of coverage you can achieve (see figure). As with any type of statistics, it's up to you to weigh the results and decide what they mean to you.
Coverage statistics by lines, objects, and files in a project are all important to VFP -- and the Coverage Profiler investigates them all. Thinking about dependency coverageIf you've tested every pathway or avenue from which a line of code or method can be accessed, you can say you have 100% dependency coverage. In VFP 5, the coverage log didn't give you much information that could help you determine dependency coverage. If you were careful to track the changes in method or procedure names from line to line in the log, you could track dependency, but this would be quite tedious. In VFP 6, an extra column was added showing you the callstack level, which makes it much easier to see the paths through which you've reached any line of code. 100% dependency coverage is a nice idea, but quite possibly not achievable, and the Coverage Profiler doesn't touch it by default. The Coverage engine behind the Profiler gives you access to a vast amount of information (including, of course, this new column). It doesn't display all that information, but it makes it easy for you to decide how and what you want to display. Why doesn't the Coverage Profiler application use or display this information? There are several reasons:
What is this number? Should the number include counts for objects not instantiated in VCXs or project files not executed? Should the tool look through all code for KEYBOARD statements and macros before it is satisfied with " total number of paths" for a Keypress method? What about MOUSE statements for a Click method? What about macro-expanded expressions that may include a call to a method or procedure? Don't forget about ON… statements that may execute this call when you look for potential paths; I'll return to this issue in the section on " Uncoverable and unattributable code" below.
The Coverage Profiler's standard display is biased in favor of statistics it can give you, and this is obviously not one of them -- until you figure out what " total number of paths" means.
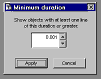
In spite of all these cautions, don't throw the concept of dependency coverage away. Making sure that your code is not just covered but covered through different pathways is quite important. Just recognize that this aspect of testing is not subject to the same rigorous metrics as you may apply to other aspects. Testing is as much an art as it is a science. ProfilingProfiling is about how much time your code took to run. The log shows statistics against individual lines of code, but profiling is not really how much time your code takes line-by-line. Think of each profiling number as showing how much time it took to perform a particular action, or in some cases how long the program remained in a particular state. If a line of code evaluates or assigns an expression, then the time the line took is how long that evaluation or assignment took. However, if a line of code calls another procedure or method, then the time that other procedure or method took is included in the time required by this action. For example, consider the following short program: do mytest proc mytest inkey(5) endproc When you examine the Profiling statistics for this program, you find that line 1 in the main program took as much time as line 1 in the mytest procedure to execute; in this case, perhaps around 5.010 seconds. You know that the line do mytest did not take as much time to execute as inkey(5). However, the action of executing the line do mytest took this long. Similarly, a main program or object method containing the command READ EVENTS shows a long span of time for that particular line. In this case, you might say that the number represents the amount of time the application was in the READ EVENTS wait state. That includes all the time the user was performing useful activities within the READ EVENTS state, by the way, not just the periods of inactivity. As explained earlier, at least at the granularity that you can get in VFP, you want to concentrate on identifying important problems here, not on tweaking performance. As you can see, you also have to identify which kinds of lengthy times are really indicative of problems and which are not. In the example I just gave you, the lengthy times a READ EVENTS line is not a problem, but if a particular method took an inordinately long time, perhaps you need to check it out. Cov_LimitDuration is a subclass of the standard Coverage Profiler interface class you'll find in COV_SUBS.VCX, in the \SUBCLASS folder (see COV_SUBS.TXT). If you're interested in identifying problems through Profiling, you can use this class to limit the items analyzed and displayed. It brings up a dialog that adjusts the records in the source workfile before creating target records to your specifications.
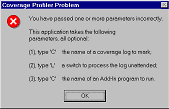
Cov_LimitDuration's dialog allows you to target source files and objects containing lengthy procedures and methods only. George Sexton (mailto:gsexton@mhsoftware.com) has written a log-analyzing application you'll enjoy, especially if you are more interested in profiling than coverage. George concentrates on performance and timing statistics, and his interface gives you well-targeted opportunities to cull or sample information from large logs. George plans to make his application available to the VFP community; check with him for its current location. Cov_omitter, discussed below, is a subclass of the Coverage Profiler that shows you what techniques I recommend for handling this type of sampling within the shipping interface. Whether you use the shipping COVERAGE.APP, George's application, or any other analysis tool, you will get a better sense of Profiling times (somewhat finer resolution) if you use a very slow machine to generate the Coverage log. However, you'll then want to move your log and your code to a fast machine to analyze the results. If you do this, you'll find it convenient to keep the same path information for the source code as you used on the original machine. This way, the Coverage Profiler will be able to identify the source code components without asking you to locate these files. You can also analyze source files and logs that remain on the slow computer, from across a network on the fast computer. You'll still have to identify some path information for the Profiler if you do this, because the file locations won't look the same from across the network as they did on the original machine. You have another choice: you can remove pathing information from the log. This is described in the section on tuning below, and requires that you understand how the Coverage Profiler understands paths and file locations. Manipulating, Enhancing, and Tuning the Coverage ProfilerCov_LimitDuration is an example of tuning the Coverage Profiler to give you exactly what you want. As you'll soon find out, many types of tuning you'll want to do will involve setting some limits or sampling items from the log. This will help reduce the diskspace, time, and memory required to do Coverage analysis and -- if done properly will still give you productive results. This section explores some of the many ways you can adjust the Profiler. There are a number of techniques you can use to tune the Coverage Profiler and its underlying engine to your particular needs. First, you can call the app directly with its parameters, rather than calling it from the VFP menu. Try calling it with this command: DO (_COVERAGE) WITH .T. (use any non-empty, non-character-type parameter), and you'll get a messagebox showing you the parameters you can legitimately use.
This messagebox will set you straight if you call COVERAGE.APP or the coverage main class with incorrect parameters. These parameters are passed directly to the instantiated Coverage class from the wrapper program. The first parameter will pass a log filename, so you don't need to pick it on startup. Alternatively, if you analyze logs directly after creating them, don't bother to SET COVERAGE TO <nothing> before you start the Profiler. The Coverage object will automatically turn coverage off and analyze this log without bothering to ask which log you wanted. Later, when you release the Coverage object, it will ask you if, and how, you would like to re-open this log. The second parameter is for " unattended" Coverage runs. If you pass .T. here, no interface will appear. The engine will automatically mark all the source code it can locate without your help, in both Profiling and Coverage styles, and save the resulting target workfile to disk. (Later in this paper I'll describe the various workfiles in more detail; for now, just remember that the " target workfile" holds the Coverage analysis results.) If you've used COVERAGE.APP and opted for an unattended run by passing this parameter, the wrapper program for the Coverage object will show you the resulting tables in BROWSEs. (In fact, this is the only service the wrapper program performs.) The third parameter runs an AddIn in the Coverage class Init, just after the initial workfile set is created. You can use this parameter to add some user interface element to the Coverage Profiler before it appears. For an example of this type of AddIn, try the following command from your \ADD folder: do c:\work\current\coverage\current\coverage with <log name>,," add_ui" |