|
[ 1 ] [ 2 ] [
3 ] [ 4 ] [
5 ] [ 6 ] [
7 ] [ 8 ]
Session E-COVR
Coverage and Advanced Testing
Lisa Slater Nicholls
lisa@softspoken.co.nz
What we’ll cover
This session is about testing apps thoroughly. That's a tall order,
because testing means more than just " running tests" .
Tests have to be designed, before they're run, and interpreted afterwards.
A large portion of the session is devoted to showing you how to get
maximum value from Coverage analysis in Visual FoxPro. You will learn
to tune, extend, and subclass the shipping Coverage Profiler classes.
You'll also learn about the concepts of Coverage and Profiling as
they apply to, and are implemented in, VFP.
The SET COVERAGE TO <filename> command, which was new in VFP
5, automatically generates a log during code execution. This data
can help you pinpoint areas of your code that may not have been tested
sufficiently, are under-utilized, or are responsible for unacceptable
delays. COVERAGE.APP, shipping with VFP 6, analyzes the log for you
and allows you to explore these possibilities.
Coverage is a new and exciting feature in VFP, but it's only part
of the picture. To make your apps robust, you should be familiar with
some other testing concepts and tools, beyond coverage and profiling,
so the session introduces these additional topics for you to evaluate
and investigate.
Bug-flushing is respectable work
When you look for defects in code, it's often difficult to keep your
mind on this goal, as separate work from code development. As developers,
we're all problem solvers, and we like to fix things. It eases our
personal pain. This is one reason why having testers who do not develop,
if your organization is large enough, is so helpful (a subject to
which I'll return later).
Testing is not debugging
Although it satisfies our personal urges, attempting to explain or
debug crashes as you go is not as productive as logging bugs without
attempting explanation and fixes. Fixing one bug in isolation can
actually contribute to a wrong conclusion about its cause, and eventually
to more complex bugs that multiply like roaches. One bug in isolation
may be mystifying, while it looks obvious (and easy to fix) once it's
seen in the context of a bug log containing many other issues, a statistical
analysis of coverage, and other components that make up a " full
body of evidence" .
Even if you do all your own testing, do your best to collect this
evidence before you jump to make bug fixes. You'll find each bug take
less time to fix this way.
Testing is not (for once!) about performance
I mentioned that the coverage log generated by VFP helps you find
" unacceptable delays" in your code. As VFP developers,
we are so used to thinking about testing our code to tweak it for
minute advantages of speed, that sometimes we think this is the whole
point of testing.
Although you can use the log to help you tweak performance, that
isn't the kind of delay you should be thinking about here. VFP executes
most lines of code extremely quickly -- so quickly that the limited
resolution of the log gives out. Most lines will show up as taking
0.000 seconds in the log!
You can use a slow machine to bring up the timings until you can
see some relative times of execution (you'll find some tips to make
this easier, later in this paper). If you do, however, be aware that
the very act of writing the log demonstrably affects these results,
and may invalidate any conclusions you draw from the log.
Instead, the " unacceptable delays" I want you to think
about are gross timing differentials. Did a SQL SELECT take four times
as long against one lookup table than another? Perhaps a DELETED()
tag is missing or somebody overrode the .Load method of a form class
and the DELETED OFF setting is lost. Did a .Refresh() method code
take a suspicious length of time? Perhaps it triggers a lot more code
than you think it does. Is a loop running twice, or more times, is
its exit value wrongly initialized or its record set inappropriately
defined?
These examples aren't just Performance Tweaking Opportunities; they
indicate bugs. In each case there is potential for wrong results,
not just a few extra seconds of waiting. Suspicious delays in your
code are red flags. They identify bad code, not just slow code, and
problems waiting to happen.
I know you are going to test for performance anyway. You're not going
to stop being VFP developers just because I scold you; we have a reputation
for the fastest data handling on the planet to protect, after all!
Just keep reminding yourself that apps have to run without crashing,
to be described as truly fast.
With these points in mind, let's take a look at techniques of Coverage
and Profiling in VFP, so you can use them to help bug-flush.
Coverage and Profiling in VFP
In VFP, you generate a coverage log simply by SETting COVERAGE TO
<a log name> before running your code. With the results, you
can do coverage analysis and profiling. In VFP 6, the COVERAGE.APP
helps you perform these tasks.
As I talk about VFP Coverage below, I will refer to the " Coverage
Profiler" or to COVERAGE.APP separately from something else called
the " Coverage engine" . The " Coverage engine"
is a VFP class with extensive methods that work on the internally-produced
coverage log and organize its contents in a series of tables, which
I'll call its " workfiles" . The Coverage Profiler, or shipping
COVERAGE.APP, simply instantiates a subclass of this engine with a
default display of the engine's results.
You can examine all the source code for the shipping Coverage Profiler
and its underlying engine, because they're all delivered with the
product. You'll need to unpack these source files, first; you'll find
them in an archive named XSOURCE.ZIP under the HOME()+ " TOOLS\XSOURCE"
folder. You may want to unpack the source now, to refer to various
items I'll mention throughout this paper.
Some additional housekeeping notes before we get started
Throughout this paper, I'll demonstrate points with various subclasses
and AddIns. A " subclass" , obviously, may be a subclass
either of the engine or the standard shipping interface class. In
addition, be aware that " AddIns" are a feature of the engine,
not the standard interface subclass, so you can have AddIns for any
engine subclass you create. (Some AddIns will be designed to work
only in a specific engine subclass, and should error trap accordingly
when they start up.)
The paper also refers you to various source files and TXT files with
additional information. All the TXT files are part of the source code
for this session, and you'll find them in the same directories as
the relevant source code. A general README.TXT in the root source
folder gives you any necessary instructions on setting up the source.
The AddIns you see used here are in your \ADD folder. If you run
ADD_INS.SCX, shown in the next figure, you'll have access to all the
other sample AddIns and the text files that describe each individual
AddIn. Each AddIn has an associated TXT file of the same name. The
ADD_INS.TXT, in the same folder, is also available within ADD_INS.SCX
It gives you a great deal of general information about using and creating
Coverage AddIns.
The subclasses described in this paper are in the \SUBCLASS folder
in your source code for this session. You'll need to unpack the source
code before using the sample subclasses, and you'll need to Locate
their parent classes in the COVERAGE.VCX that is part of the shipping
Coverage source code in XSOURCE.ZIP.
With all this out of the way, we can return to examine Coverage in
VFP…
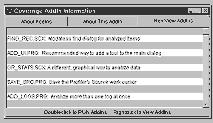
A " meta-AddIn" , ADD_INS.SCX provides text, source
editing, and execution for all the other AddIns delivered with this
paper.
Coverage analysis
Coverage analysis is about figuring out what code ran and what code
didn't run. If you haven't run a block of code, you haven't tested
it. If you haven't run a code construct, after repeated attempts,
you may need to re-evaluate your tests. If you have validated your
tests and you still haven't covered a code construct -- or even a
single line of code -- after repeated attempts to test it, you need
to re-evaluate that code.
Uncovered code may represent " dead weight" you can remove.
This is not only an opportunity to streamline your memory footprint
and the size of your app; it is an opportunity to prevent future confusion
about what your code actually does, when somebody tries to maintain
or extend it months later.
On the other hand, uncovered code may represent some other blockage,
a bug that is preventing this code from running when it should run.
This is a more dangerous, and also a likely, possibility.
Don't be too quick to prune code that you didn't cover, until you're
sure. But pay attention; uncovered code is a significant symptom.
In most situations, you are interested to see what code didn't run.
This is why the Coverage Profiler defaults to putting a mark against
uncovered lines of code; you can easily scan for uncovered lines.
You can choose to mark covered lines instead, or put a different mark
against each type (see figure ). You may choose to mark only covered
lines when you know you have done very limited testing and have a
specific area of concern in mind.
You may even choose to mark both, to clearly delineate " coverable"
from " uncoverable" lines of code. I'll explain what kinds
of lines are " uncoverable" later in this paper.
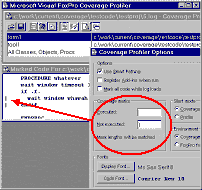
The Coverage Profiler defaults to marking uncovered lines, but
you can change this default in its Options dialog.
Looking for 100% Coverage
If you've executed every line of code, you can proudly announce
that you have reached 100% coverage. Once you have properly disposed
of " uncoverable" lines of code, this is an achievable goal, and in
fact you should attempt to achieve it in most cases.
In VFP's hybrid OOP-and-procedural language and
multiple-source-code-type packaging projects, there are actually
several different sorts of 100% coverage you can achieve:
- 100% coverage of all the lines in accessed procedures and
methods of objects that instantiated
- 100% coverage of objects in class libraries. Especially if you
use class libraries from multipl
e sources in a large application, it is important to consider
object coverage before you get too fussed about your line coverage
statistics. If you got 100% line coverage but only " touched" half the
object, then you have 0% coverage on the objects never hit. Is this
okay? Do you need to re-package libraries to manage dead weight, or do
you need to make sure you test those other objects?
GR_STATS.SCX is an AddIn showing a graphical interface to allow
you to concentrate on object versus line coverage for the
object-containing source code files represented in your log. This
AddIn also provides one of the multiple log interfaces in
ADD_LOGS.PRG, and is instanced on its own as an example subclass of
the Coverage engine, in COV_ENG2.PRG, as shown in the figure below.
- 100% coverage of files in a particular project. If you're trying
to make sure you've tested an application, you may have 100%
coverage of the lines in the files you hit -- but did you execute
all the files with code?

[ 1 ] [ 2 ] [
3 ] [ 4 ] [
5 ] [ 6 ] [
7 ] [ 8 ]
|